The device supports the IoT platform MIC from Telenor. The device will automatically be visible in your Telenor MIC-account together with your other devices. If you want to test, MIC, let us know so we can let you in our demo platform.
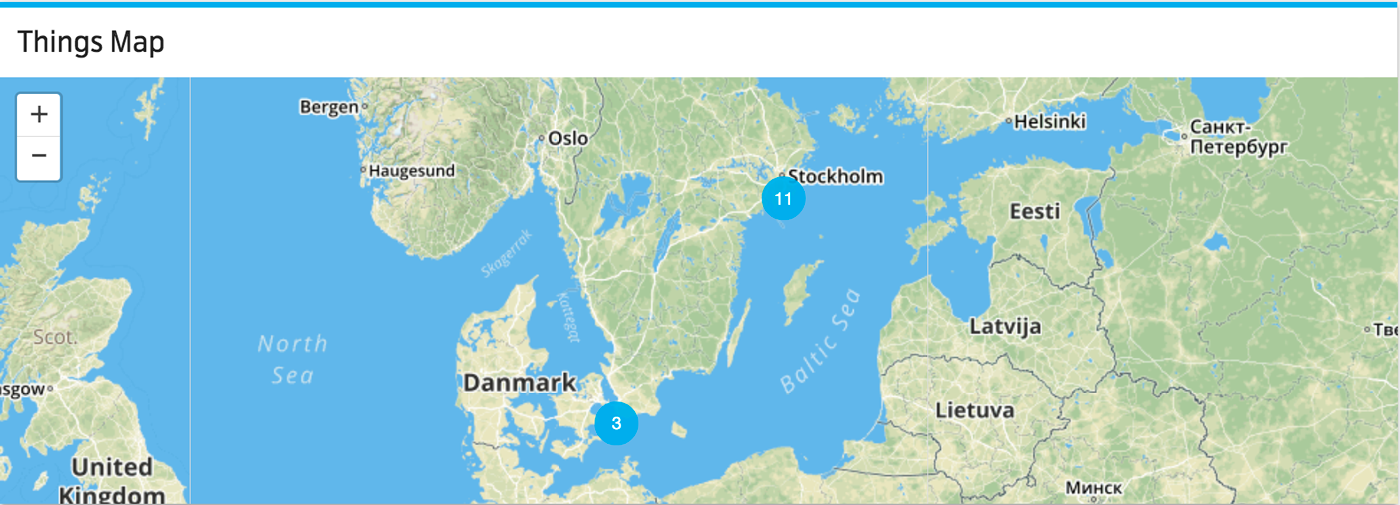
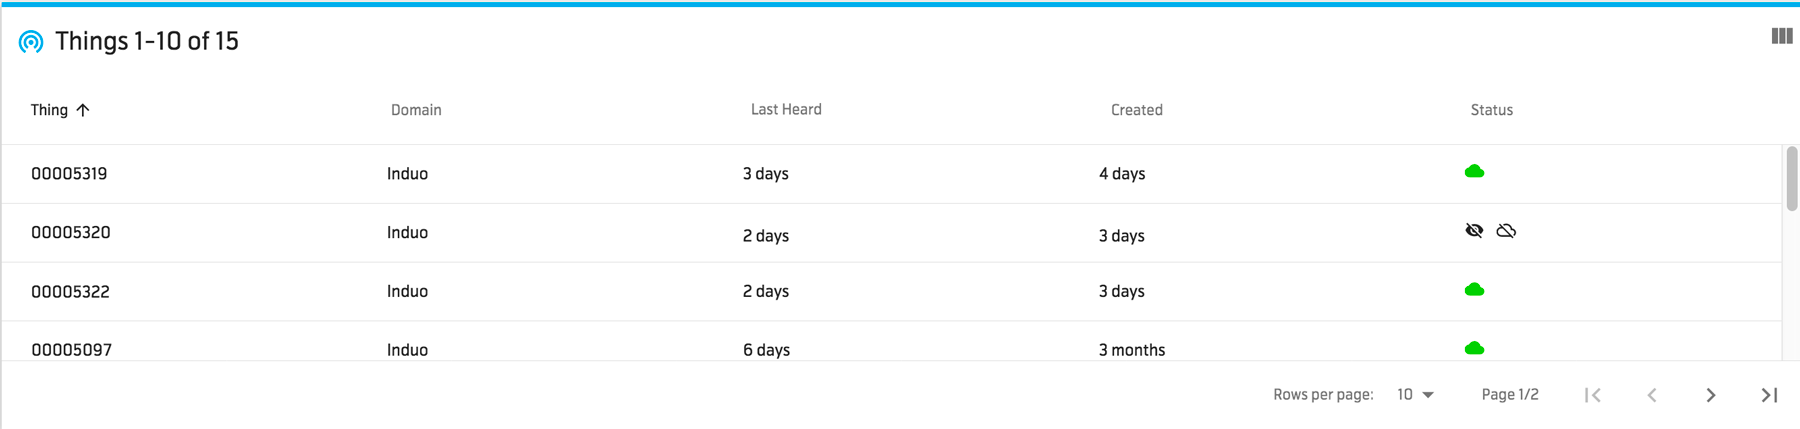
AKKR8 devices are available in the Things list or on the map for example.
DEVICE DATA
To see a devices data, click on the map or the Things list and you will see this window where you can see a lot of parameters related to the device.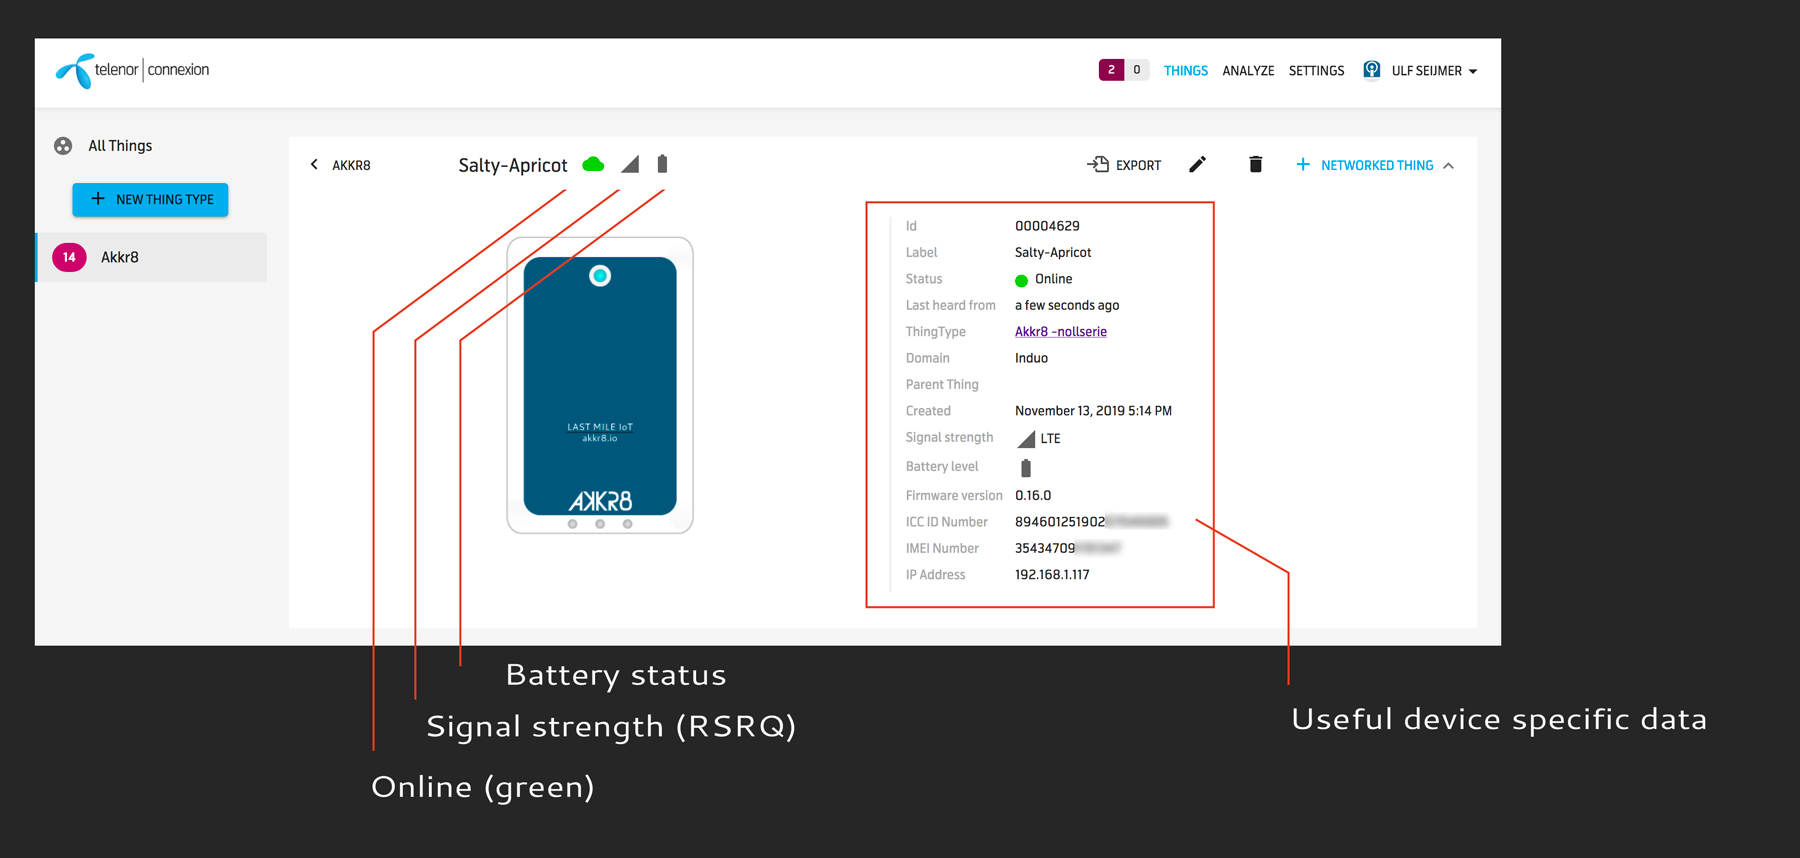
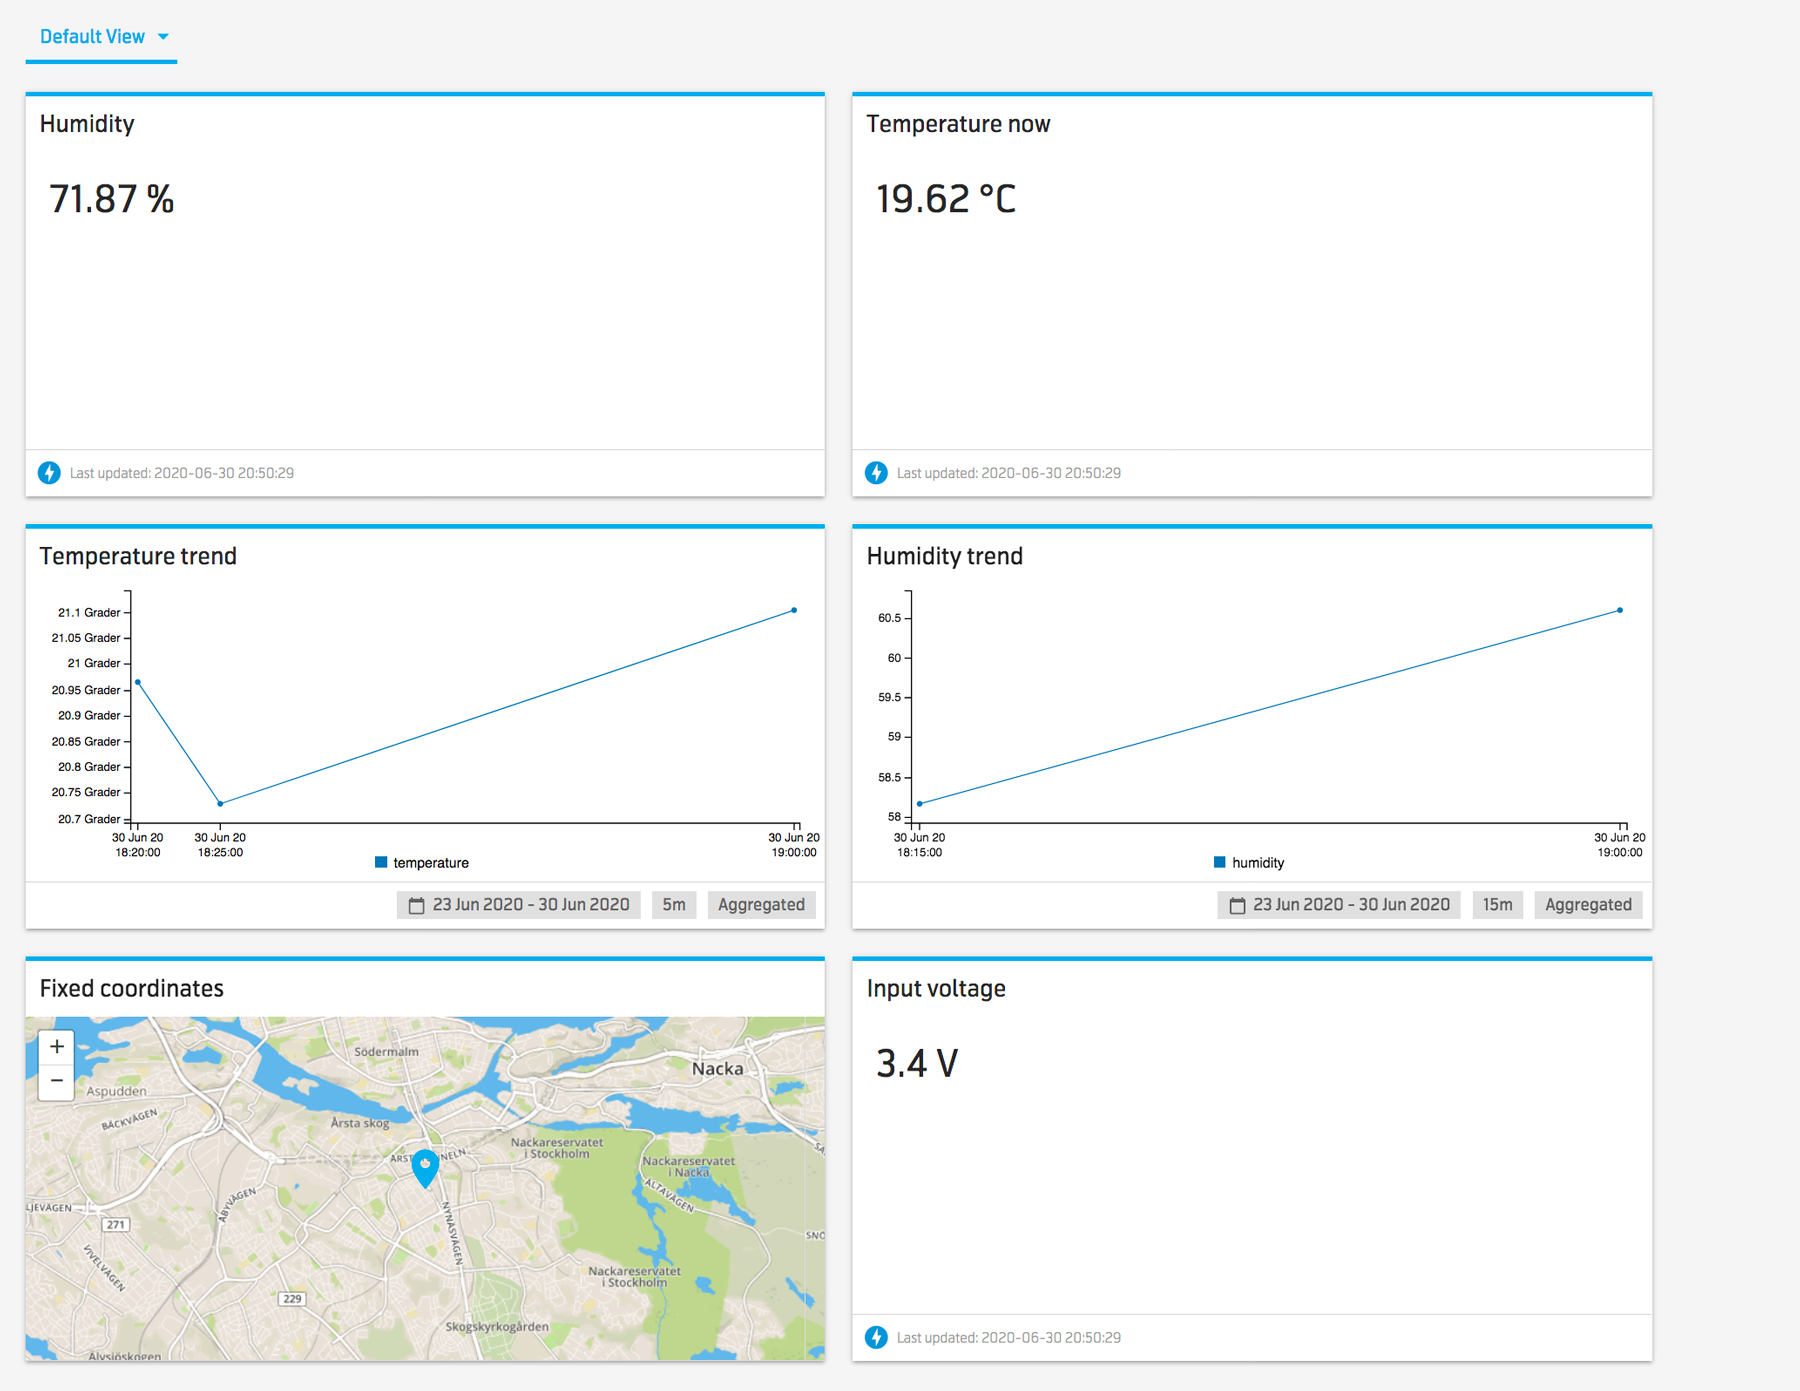
SENSOR DATA
When it comes to sensor data the dashboard can be customized widely and we can help you create the dashboard of your dreams. This is just one example on how the sensor data can be displayed.
In order to see sensor data for an individual device click on your Thing group in the left panel under ”All things”.
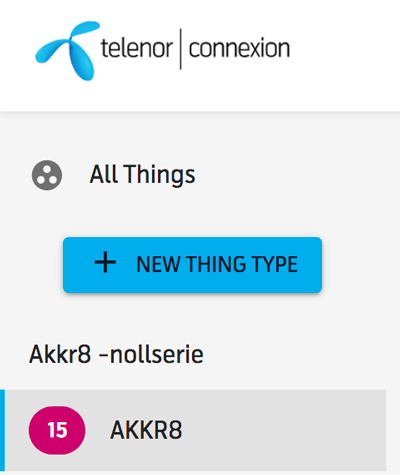
Now you can see the individual Things in your group via the map, or via the list.
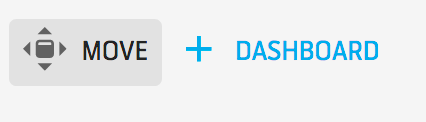
 From here on you can add the widgets you would like to display data and creat your custom dashboard. Start by clicking move.
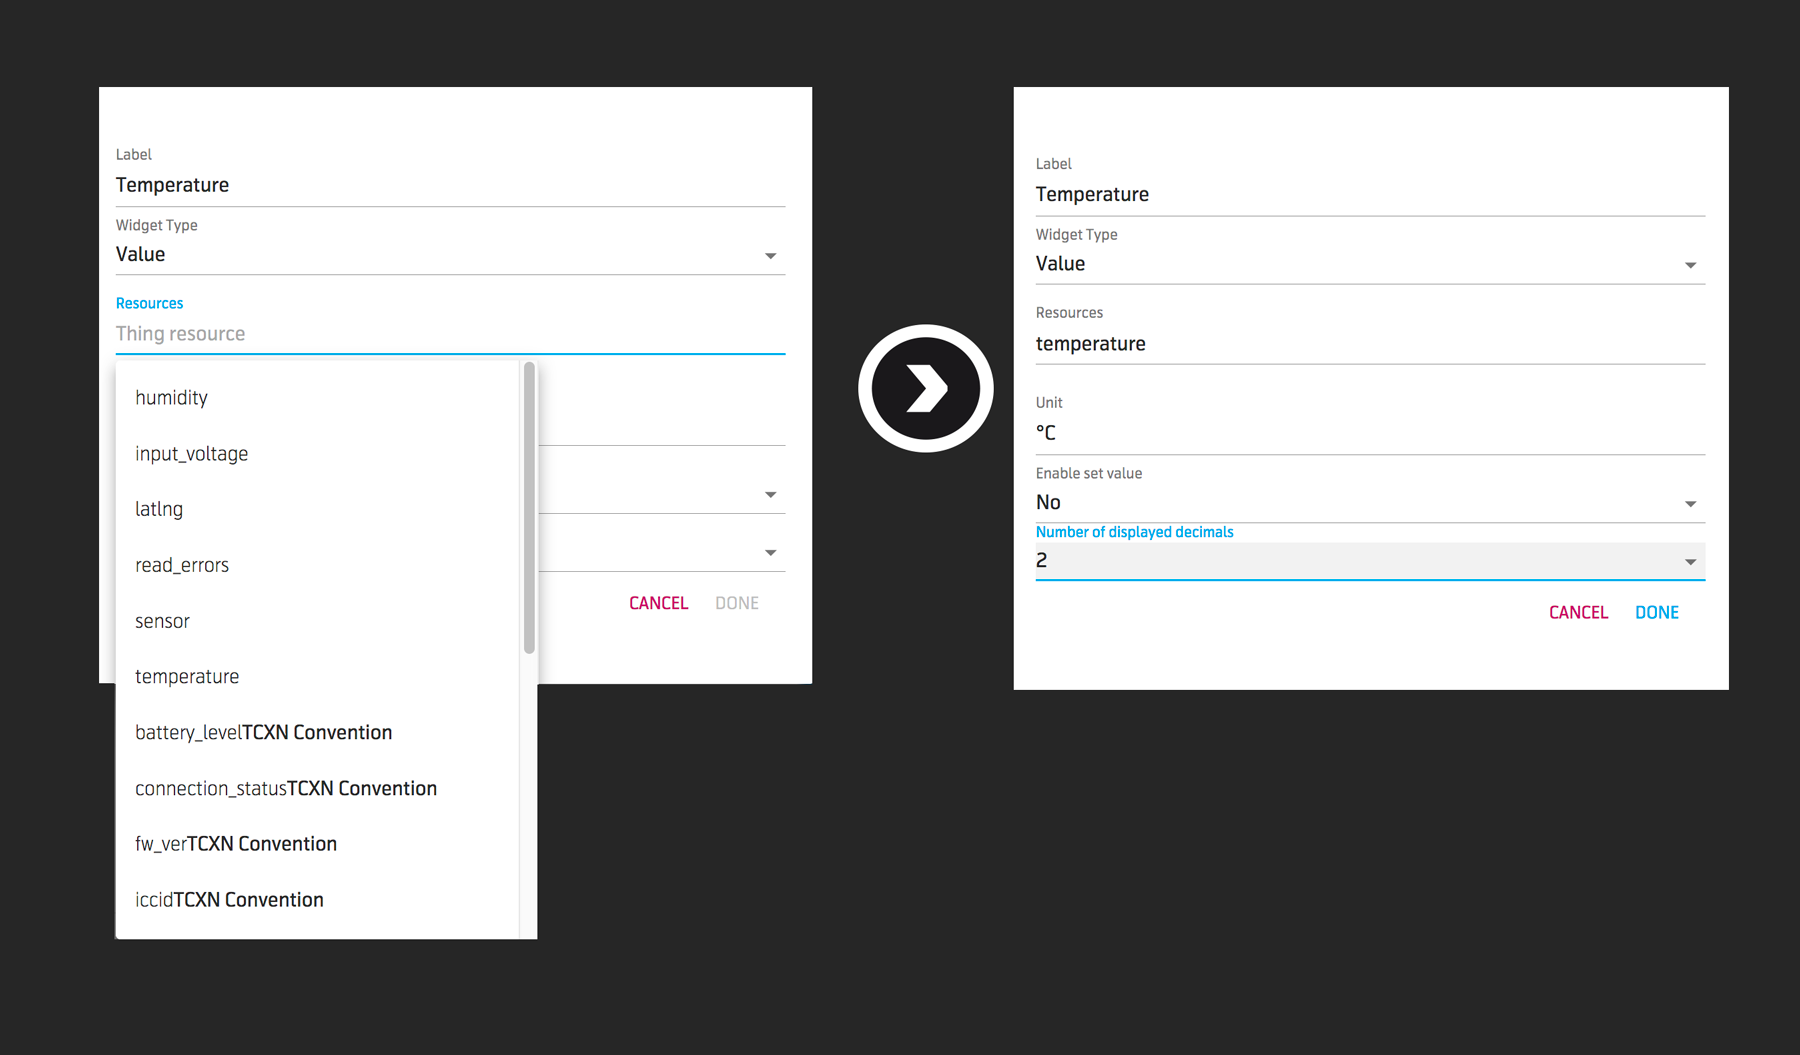
Add your new widget by clicking + Widget

From the popup you can select what widgets to add and name it to your liking. In order to display data you must pick a resource from the thing in question. This is like temperature, humidity and what you would like to display. See below for an example:
This will add the temperature widget to your dashboard like so:
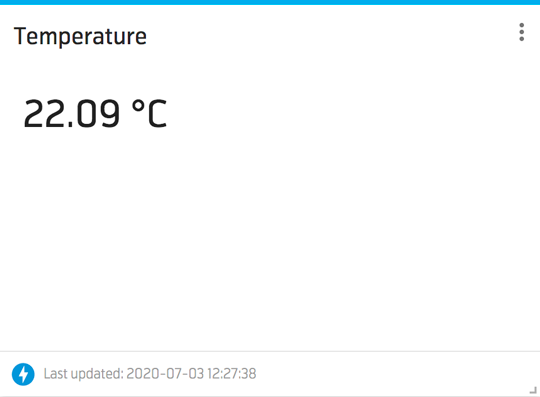
Don´t forget to save your dashboard after committing the changes.
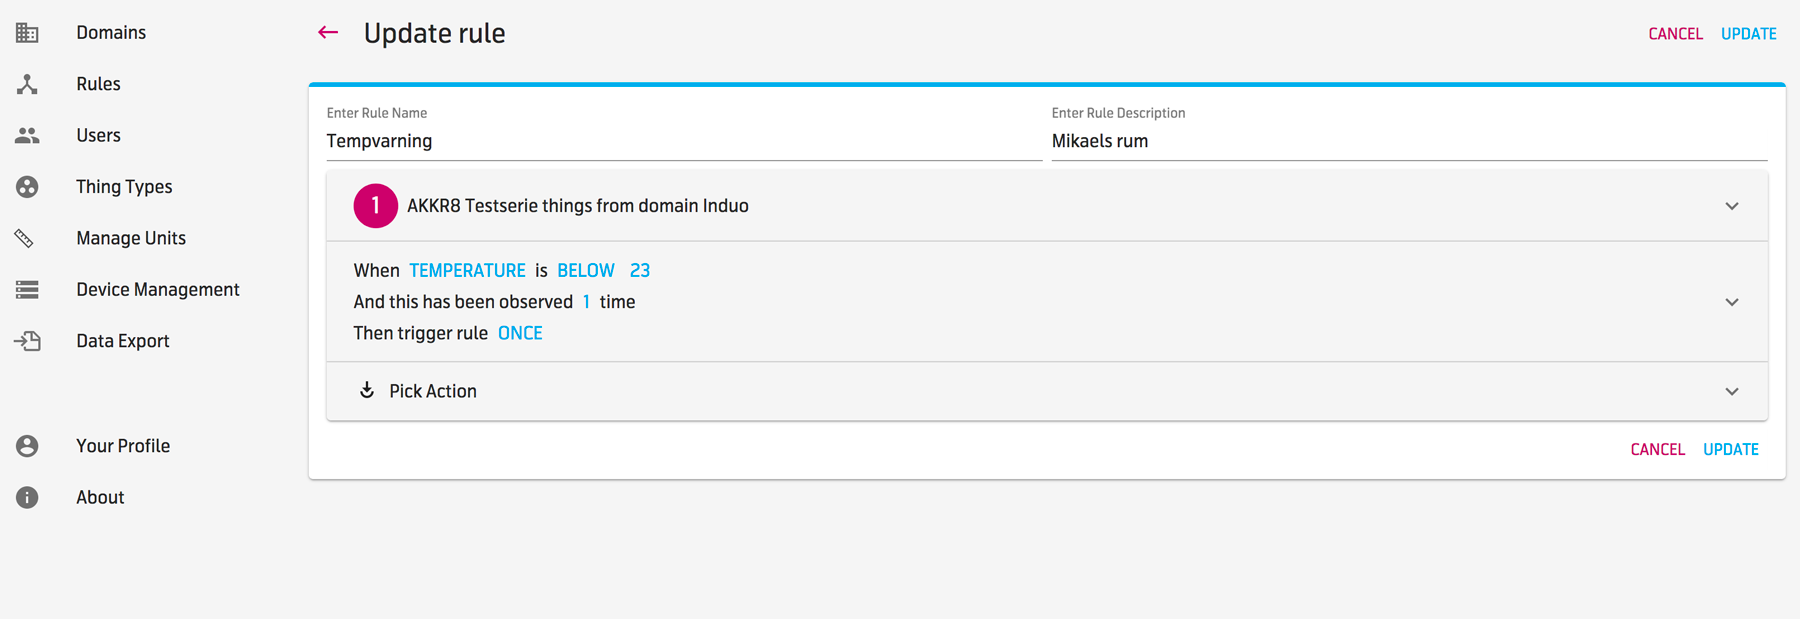
SETTING ALARMS
The MIC-platform has a very powerful rules engine. This can be used to trigger alarms based on sensor data, battery voltage and other important metrics. This is one example where a device sends an email if temperature drops below 23°C.
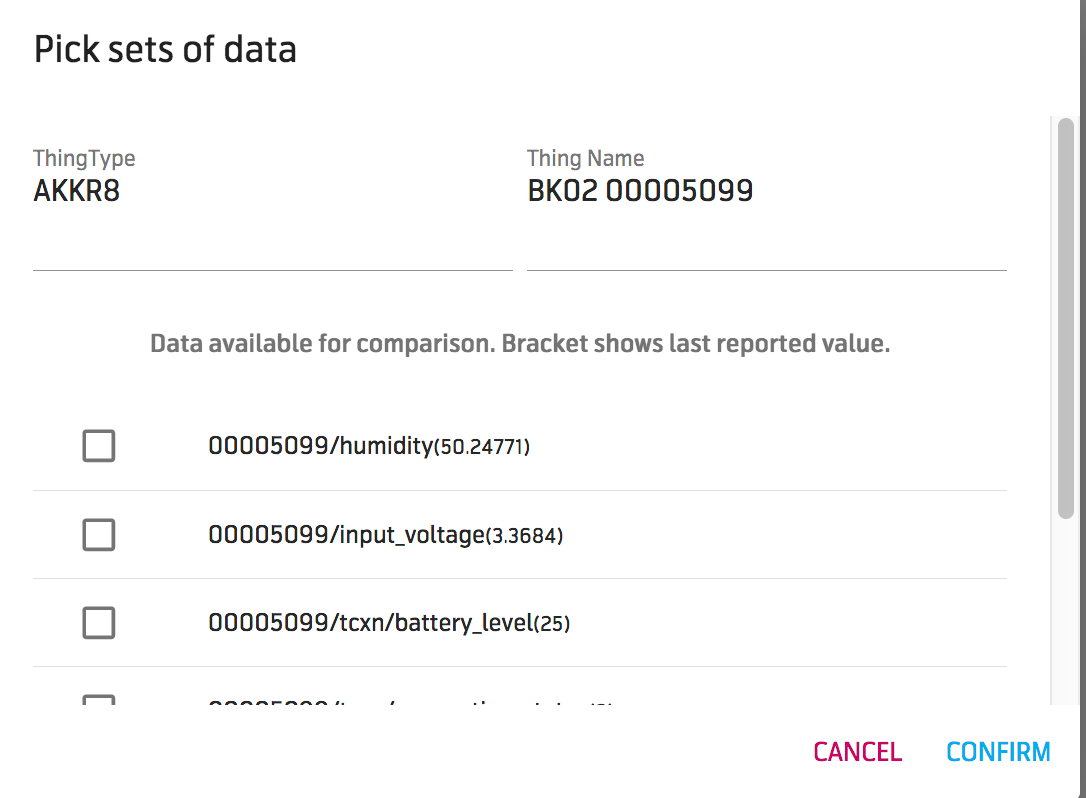
ANALYSING DATA
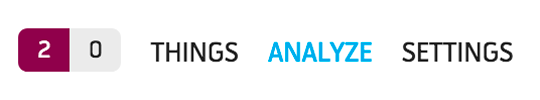
MIC-platform has an analyze tool built in. A simple data analysis could be done easily. On the upper right handside select Analyze from the menu bar.
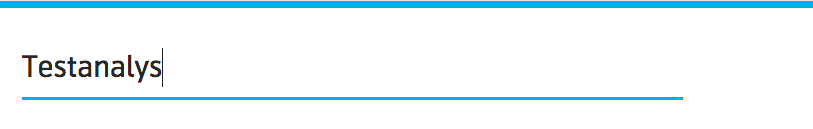
Select a name for the analysis for example ”Testanalys”
Click on Edit (with the pen icon) and select first the thing type you want to monitor, second the individual thing name and last the data points you want to add to your chart.
After adding the first thing, just click on edit again and add another thing if you want. You can select the time under time range.
If you have selected multiple things and data points, here is what the analyze could look like.

If you are happy, save the analyze by clicking the floppy icon.